Category Colour

Projection distortion
A quick fix to a map today, courtesy of Ed Hawkins over at better figures-approved blog Climate Lab Book. Ed asked “When will we reach 2°C?“, and posted this great map, showing areas of the world that have risen already by 2°C* in the last century or so. There is a nice use of appropriate […]
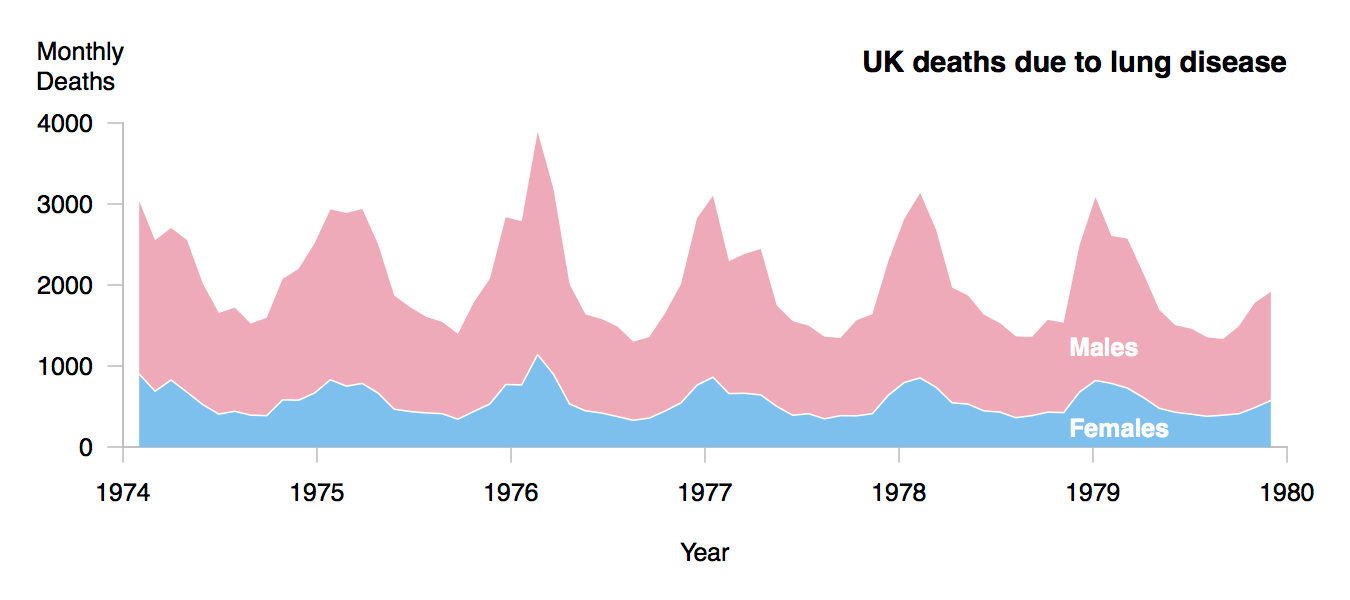
Better Timeseries
Better Figures was very happy to be invited to the Scott Polar Research Institute, to give a talk on data visualisation to the UK Polar network of early career scientists. The talk leant heavily on the advice from The Visual Display of Quantitative Information, by Edward Tufte. One of the original bits however, was a sequence […]

